Advanced Usage
Region finding
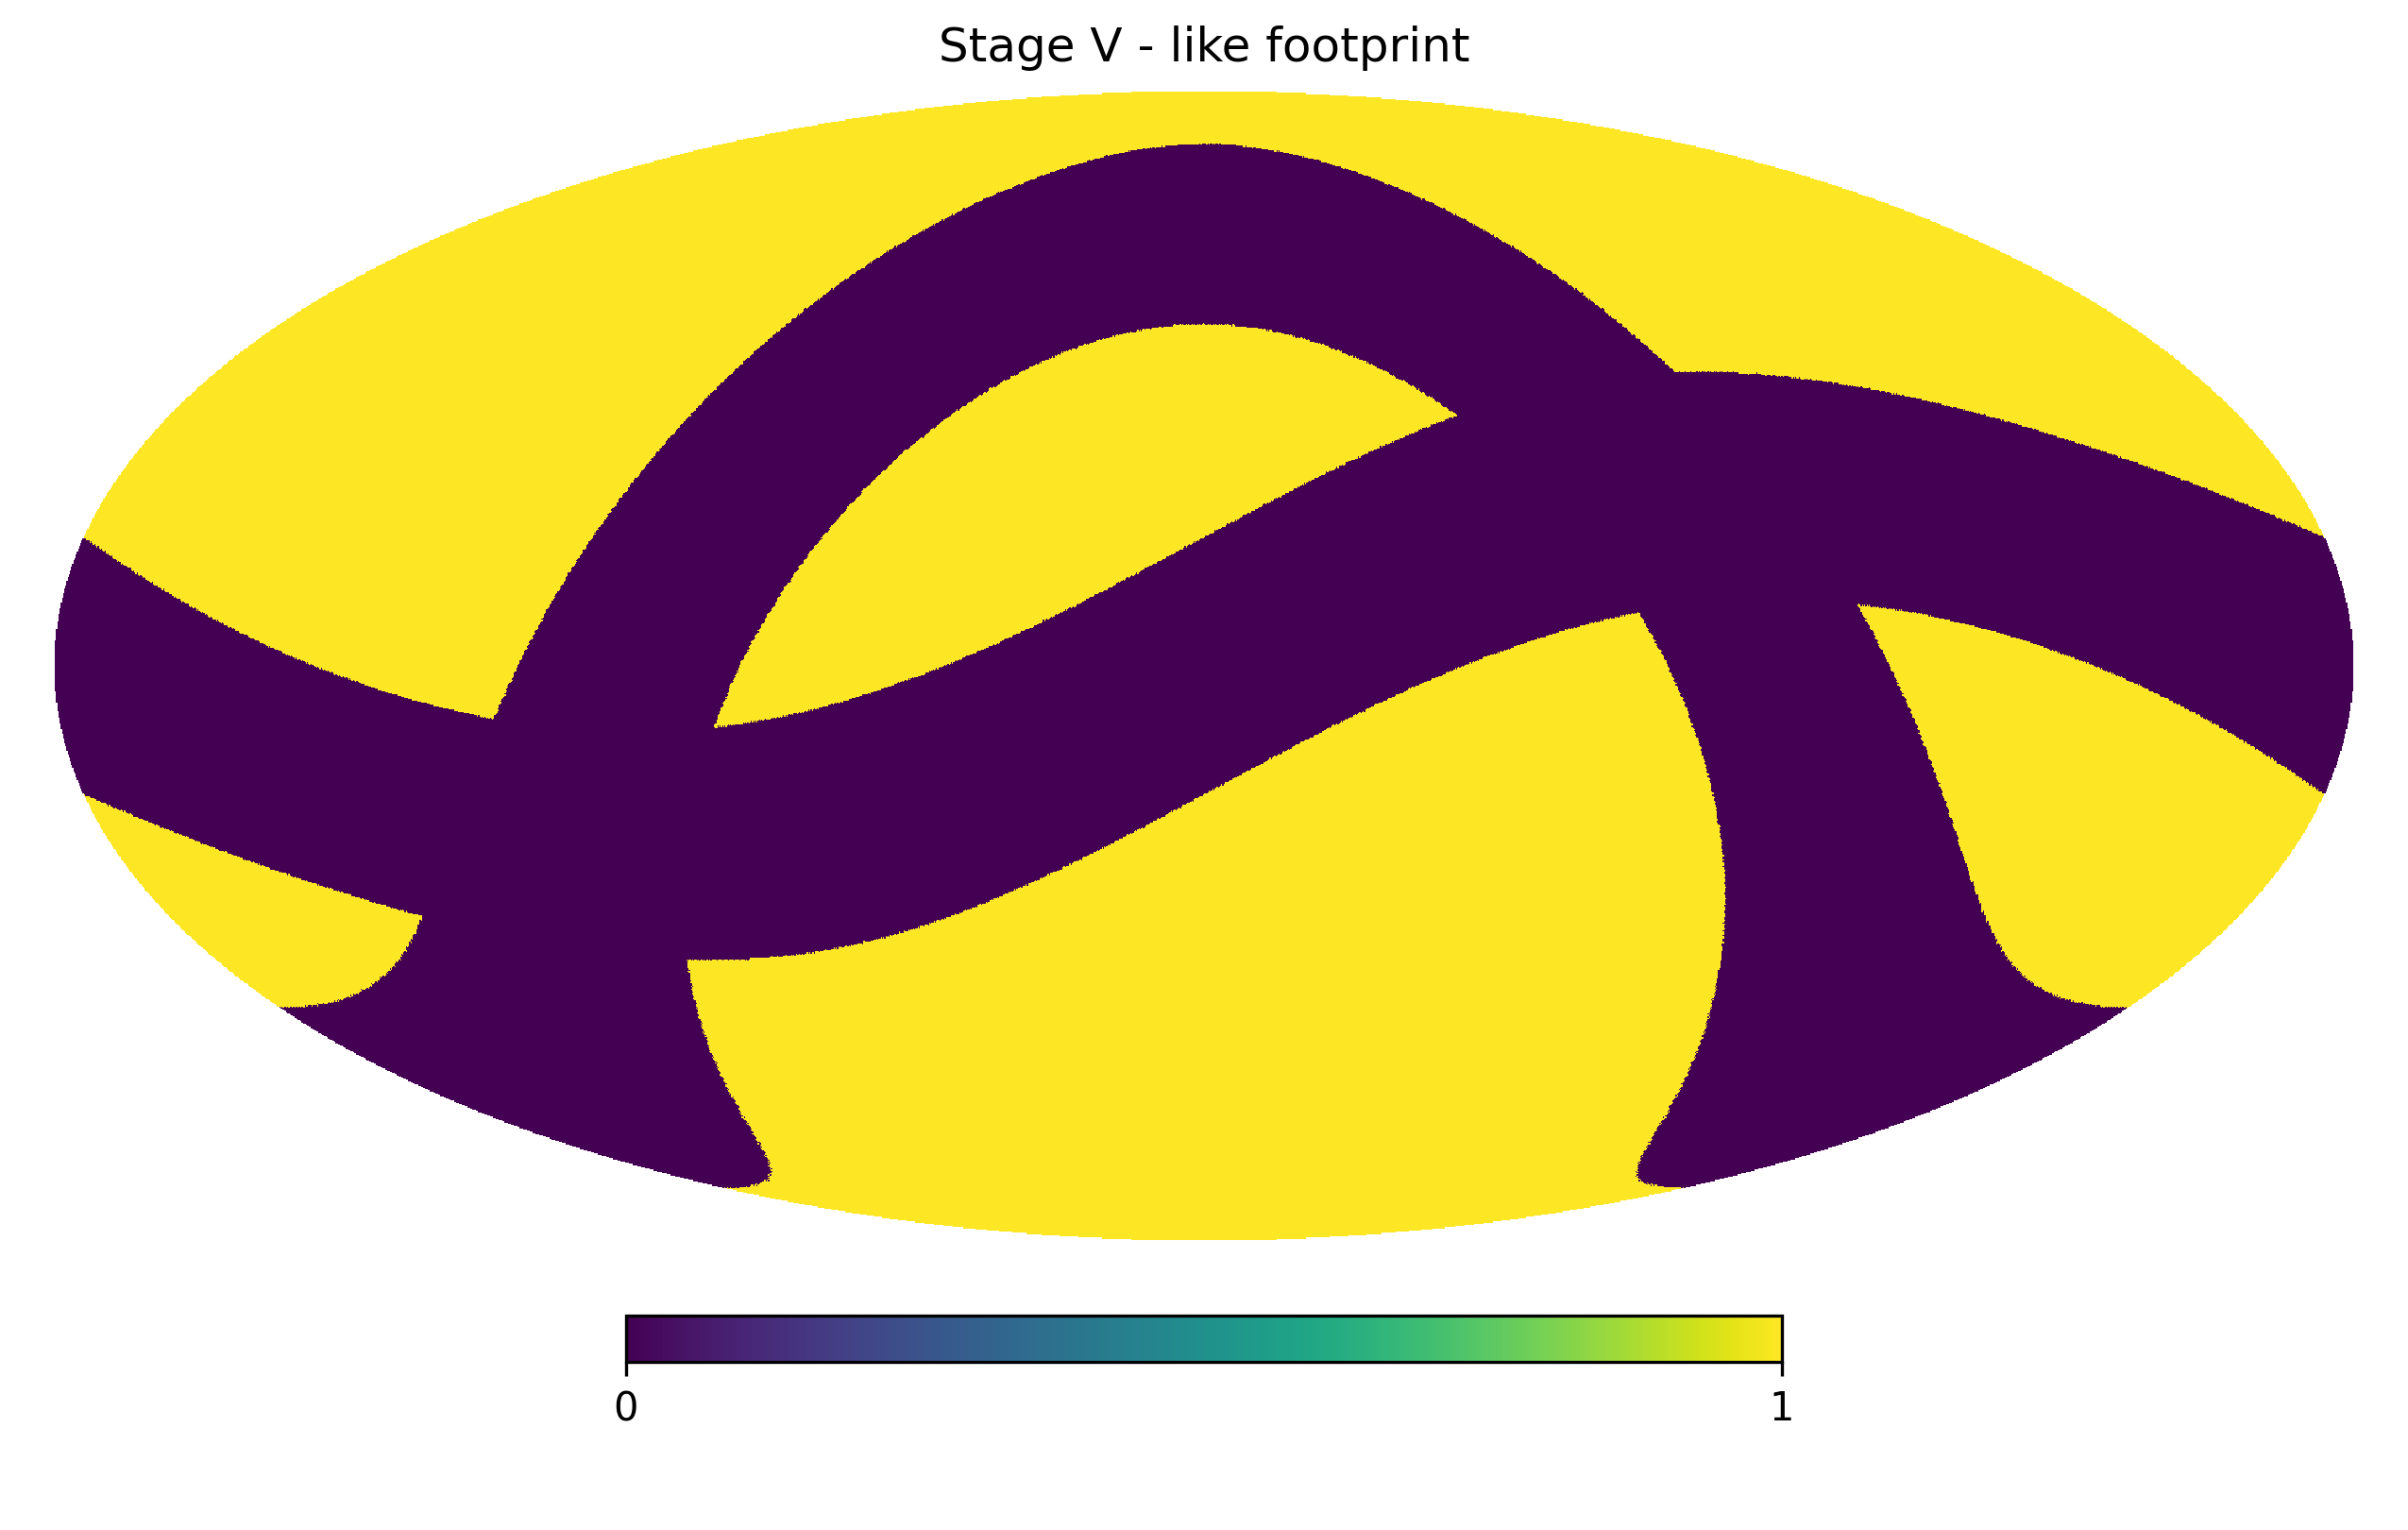
There will be cases when the region on the sky that we want to partition is complex and is non-contiguous. These regions may be trivial, but they also may be complex – for the latter it is useful to have software that can automatically identify these regions. To demonstrate how this works, let’s start by first defining a stage V survey like footprint.
import numpy as np
import matplotlib.pylab as plt
import healpy as hp
import skysegmentor

nside = 256

# ----------------------------------------------------------------------------
# the exact details used to define this are not important but placed
# here so you can reproduce this example.

pixID = np.arange(hp.nside2npix(nside))
map0 = np.ones(hp.nside2npix(nside))

rot = hp.Rotator(coord=['E', 'G'])

map0 = rot.rotate_map_pixel(map0)

the, phi = hp.pix2ang(nside, pixID)

cond = np.where((the >= np.deg2rad(90.-15.)) & (the <= np.deg2rad(90.+15.)))[0]
map0[cond] = 0.

rot = hp.Rotator(coord=['G', 'C'])

map0 = rot.rotate_map_pixel(map0)

cond = np.where((the >= np.deg2rad(90.-15.)) & (the <= np.deg2rad(90.+15.)))[0]
map0[cond] = 0.

rot = hp.Rotator(coord=['C', 'E'])

map0 = rot.rotate_map_pixel(map0)

cond = np.where(map0 > 0.5)[0]
map0[cond] = 1.
cond = np.where(map0 <= 0.5)[0]
map0[cond] = 0.
map0 = map0.astype('int')

# ----------------------------------------------------------------------------

hp.mollview(map0, title='Stage V - like footprint')
plt.show()
We can now use SkySegmentor’s inbuilt unionfinder function to find contiguous regions in the footprint. This uses an adapted version of the grid-based Hoshen-Kopelman union finding algorithm altered to work on the HEALPix grid.
Note
groupmap = 0 is used to represent masked out region.
groupmap = skysegmentor.unionfinder(map0)
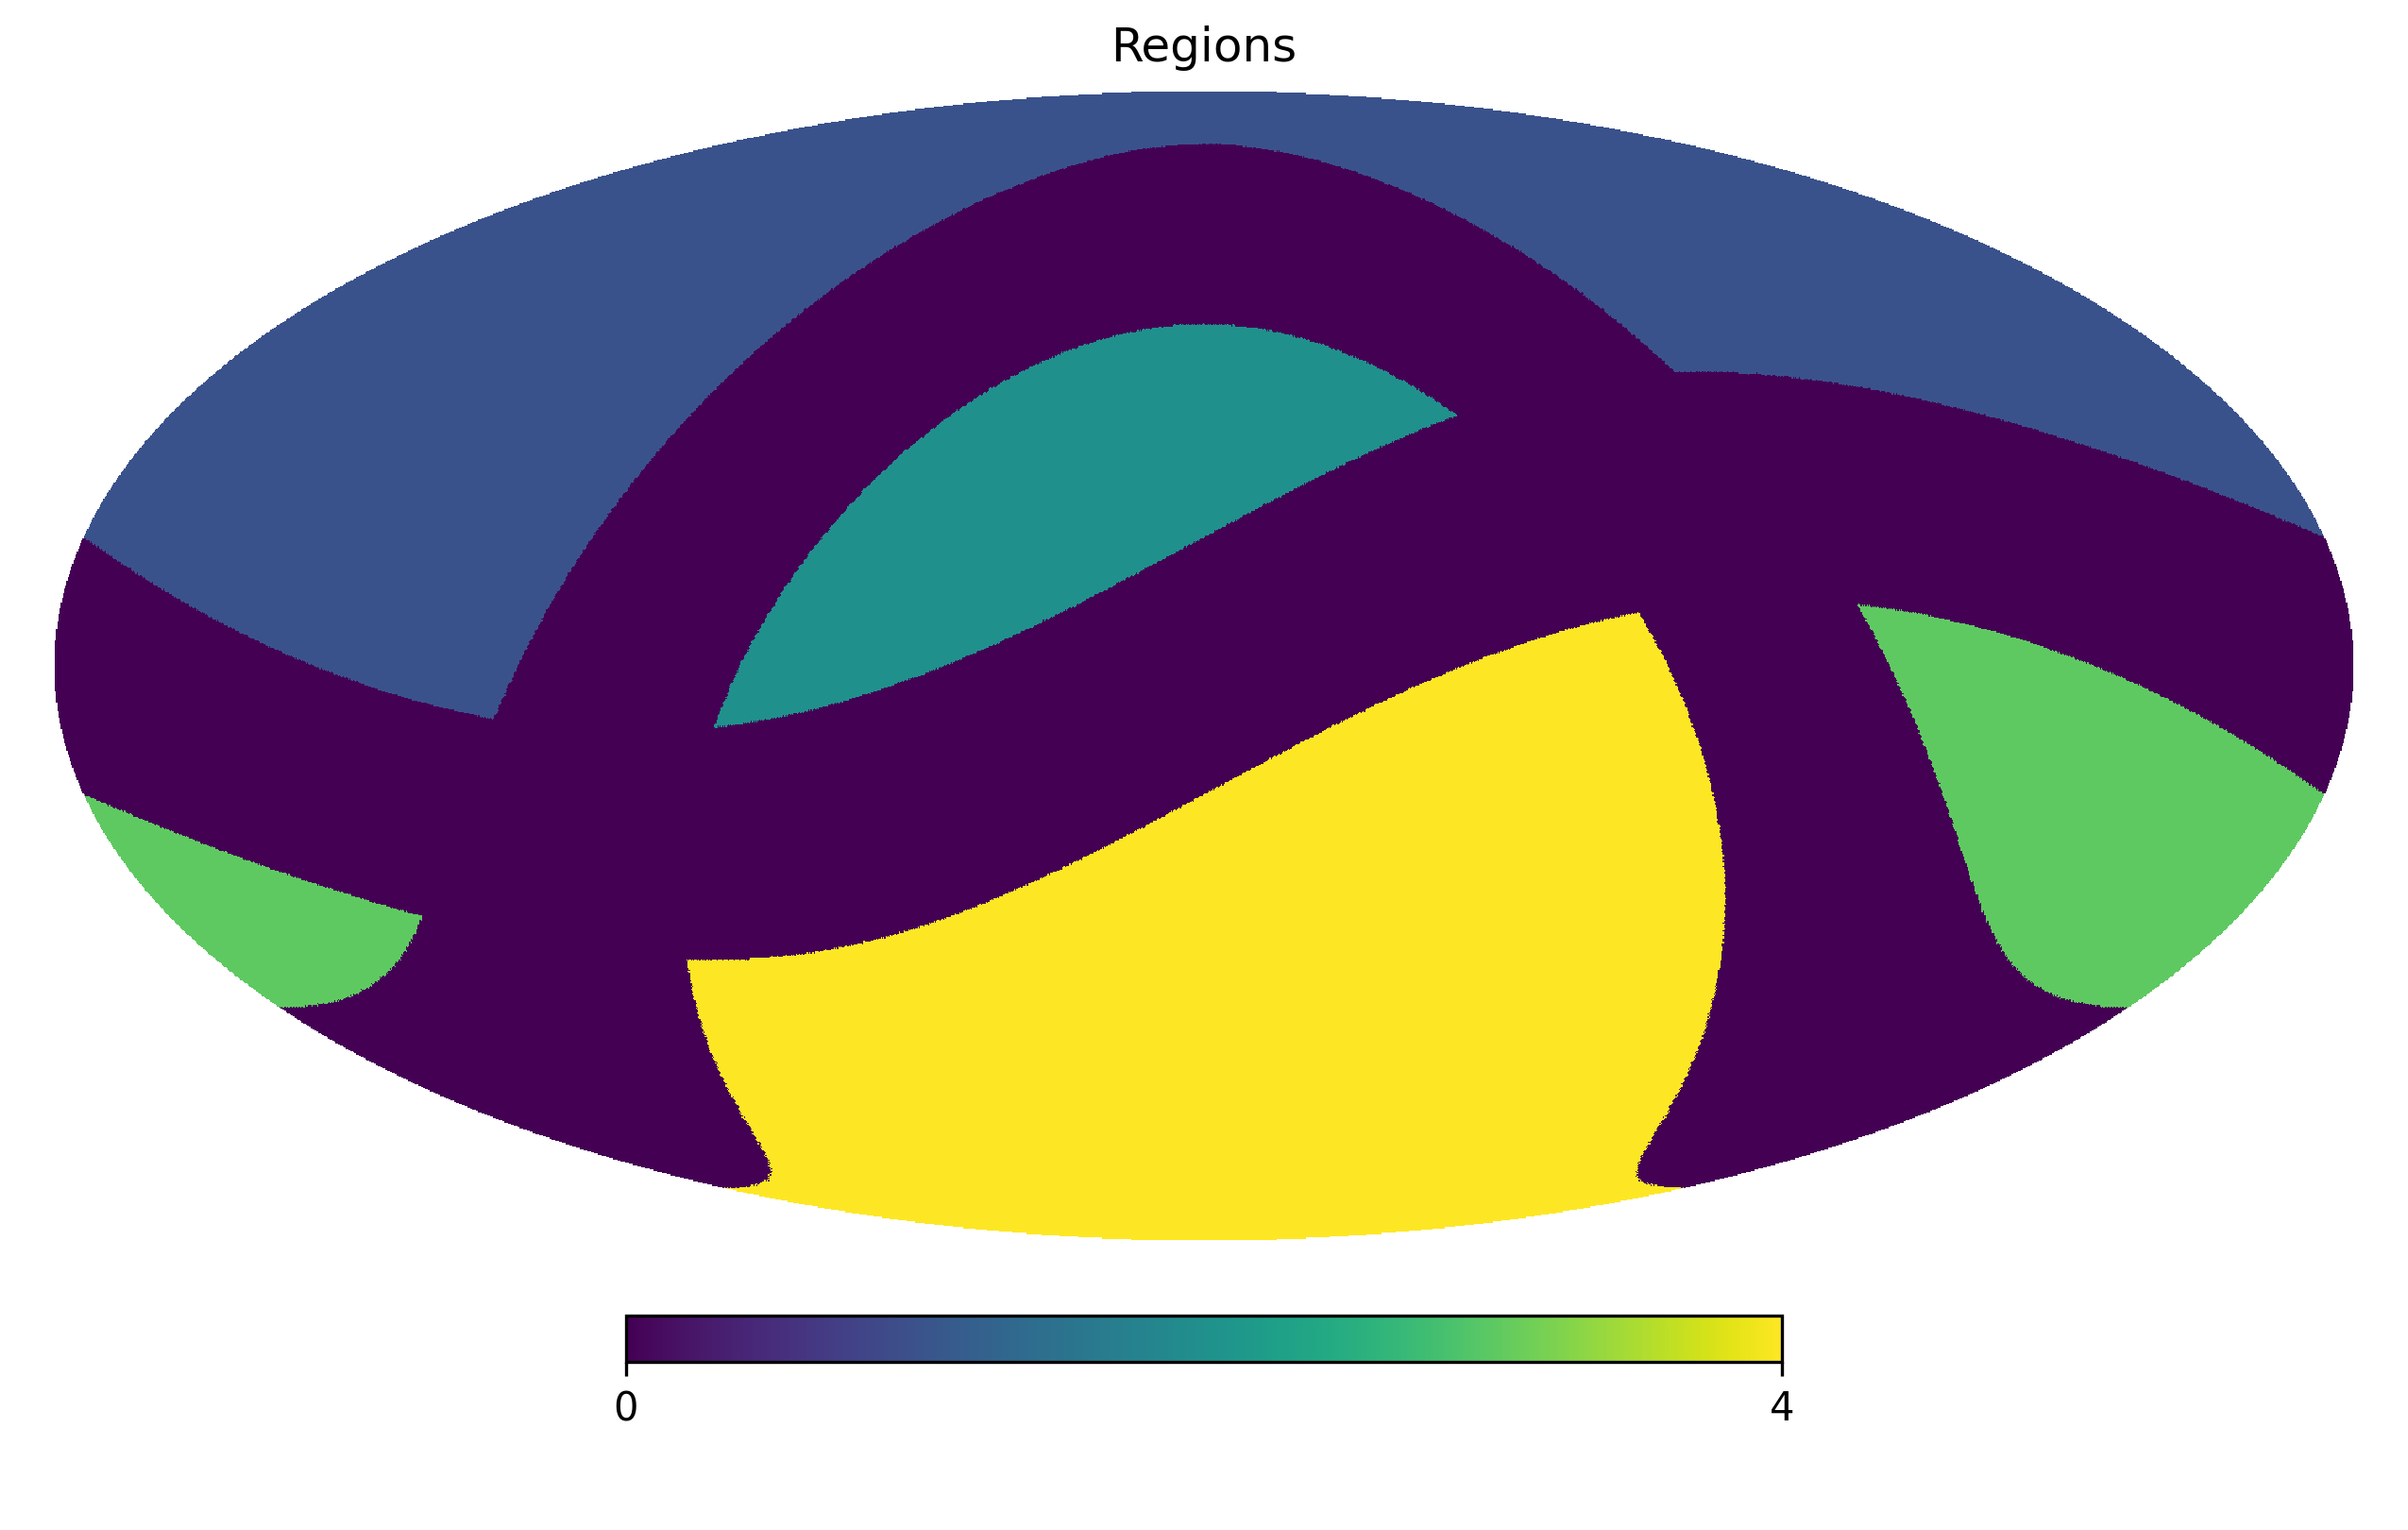
Let’s focus on region 1, by constructing a mask for region 1 only:
mask = np.zeros(hp.nside2npix(nside))
cond = np.where(groupmap == 3)[0]
mask[cond] = 1.
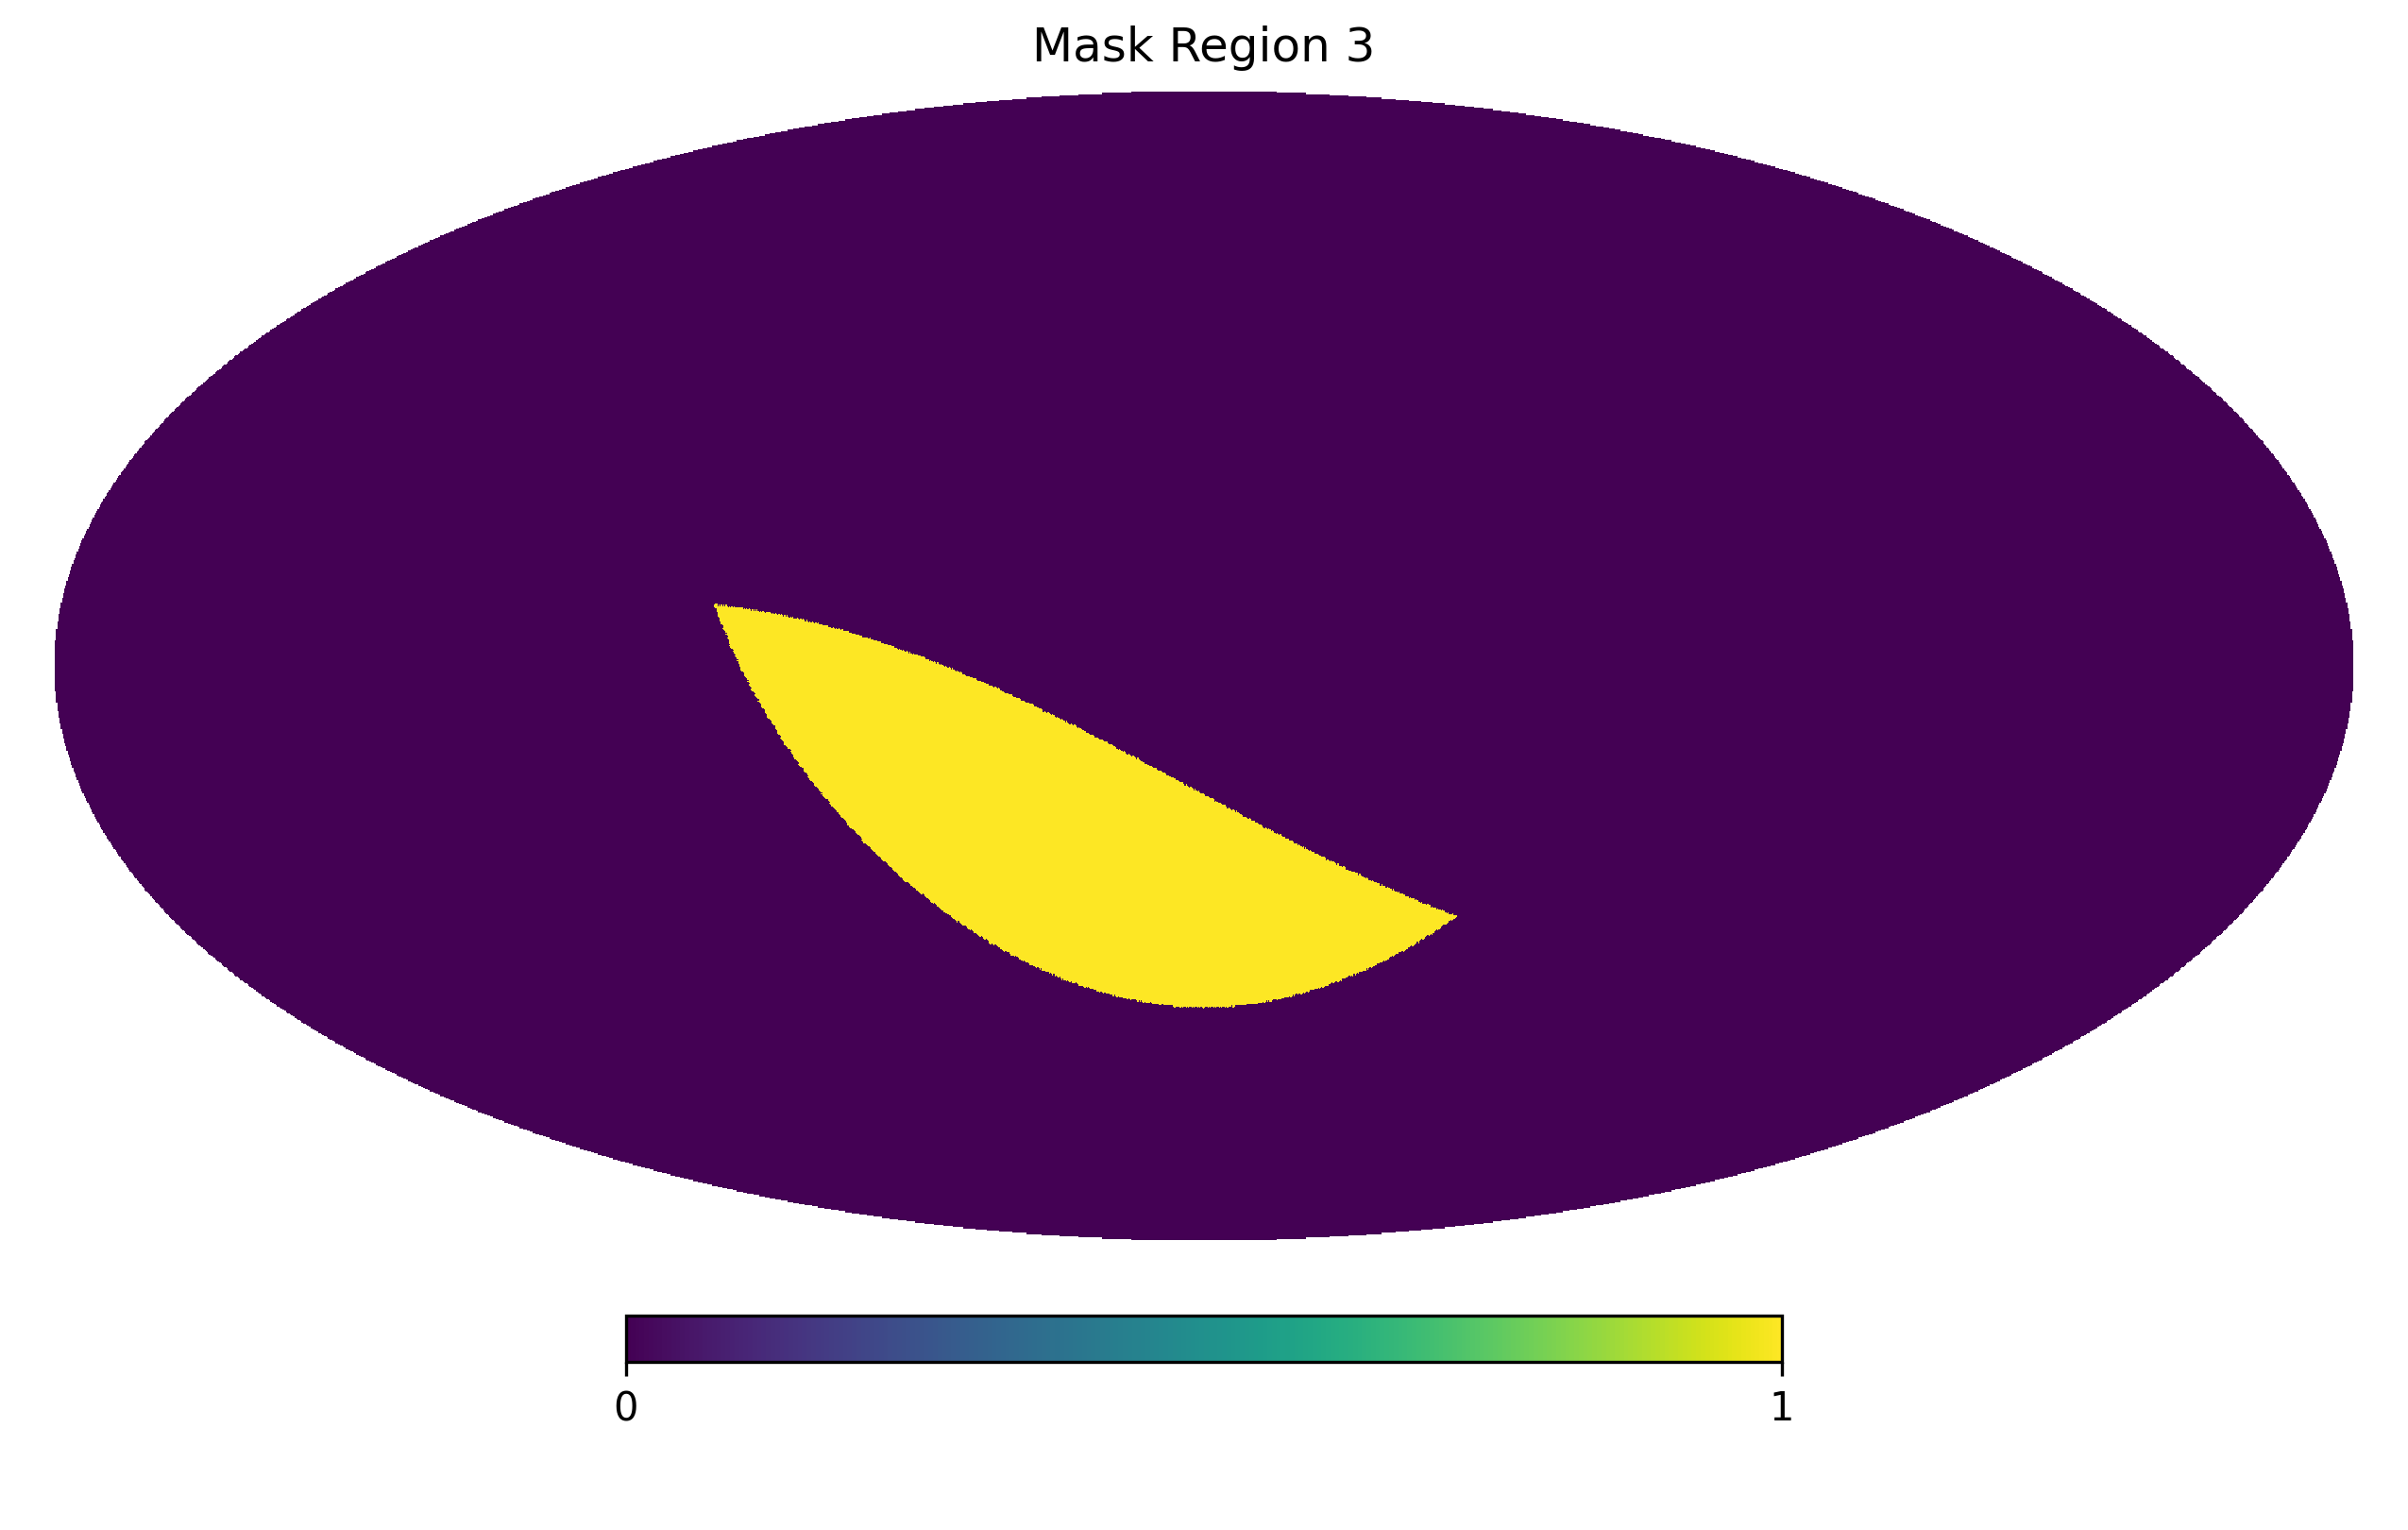
We will now partition this mask in the following section.
Partitioning a HEALPix map
We can partitioning a HEALPix mask into Npartitions by running:
Npartitions = 100
partitionmap = skysegmentor.segmentmapN(mask, Npartitions)

# and plotting the partition map

## for plotting purposes let's mask out the masked region using healpy inbuilt function
partitionmap_masked = hp.ma(partitionmap)
partitionmap_masked.mask = np.logical_not(mask)

hp.mollview(partitionmap_masked.filled(), title='Partition Map', rot=180, xsize=2000, cmap='twilight')
Note
partitionmap = 0 is used to represent masked out region.
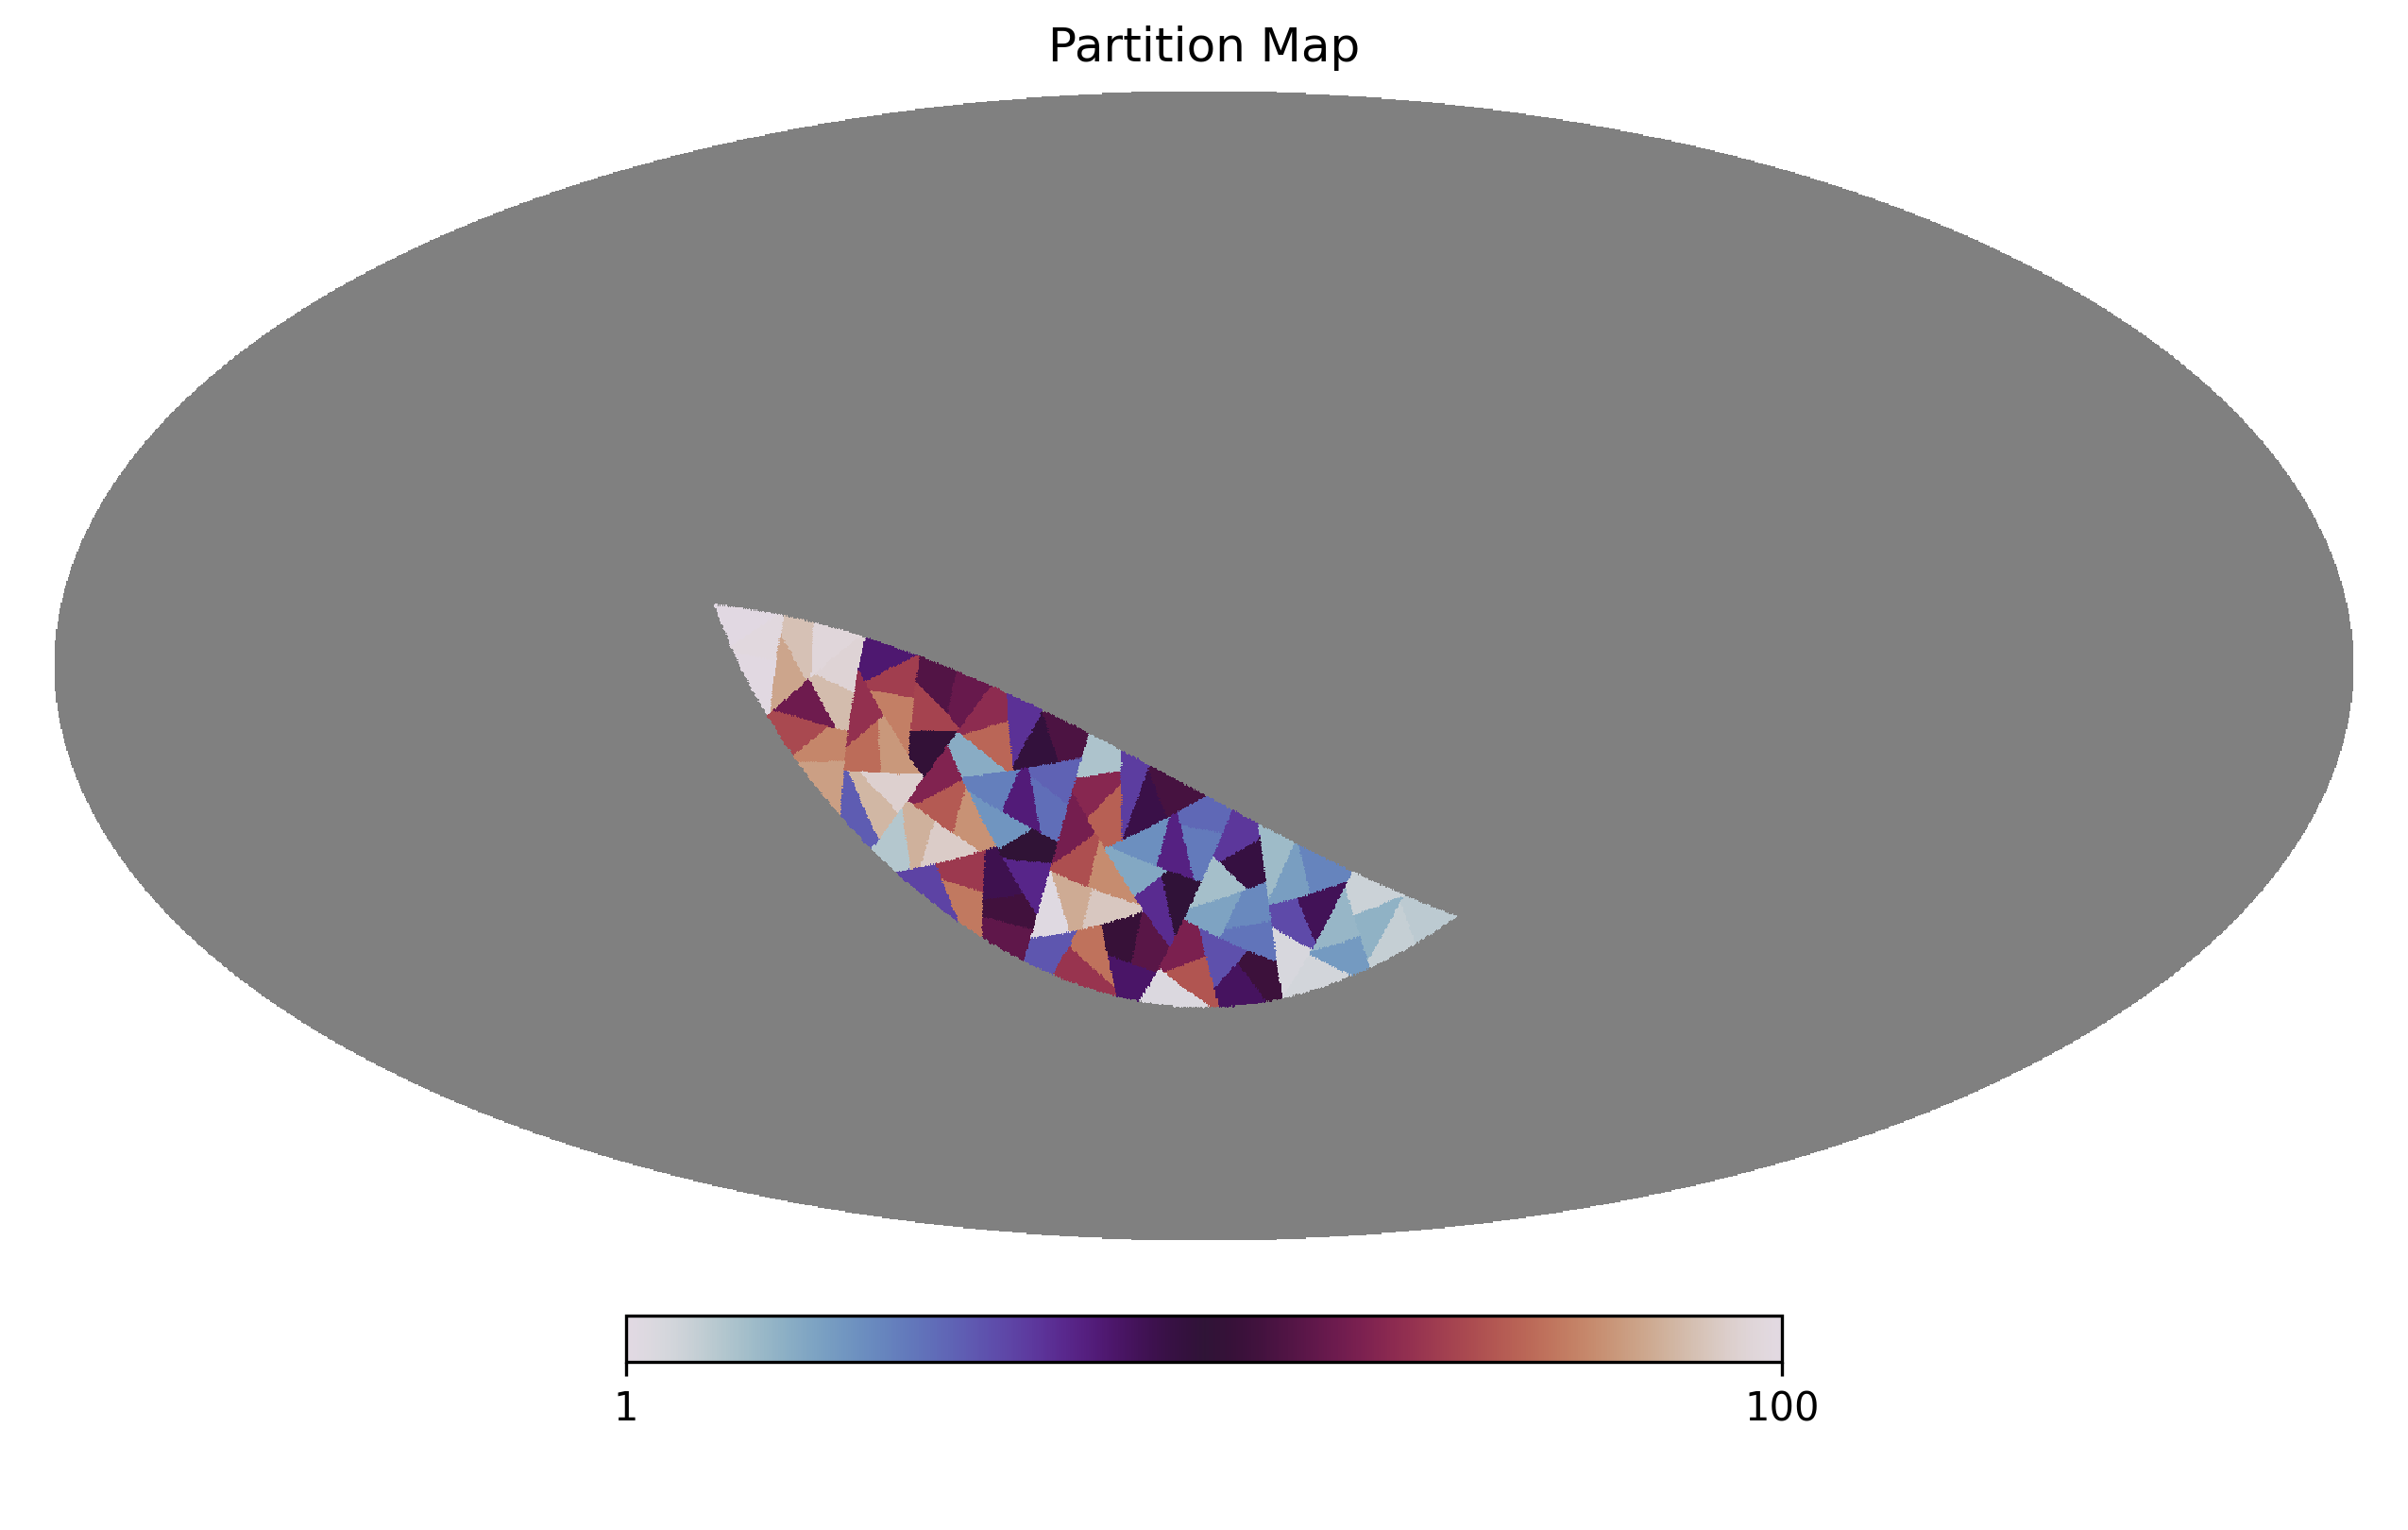
Note
This is assuming Npartitions is smaller than the number of pixels in the mask and thus not limited by the pixel scale of the map.
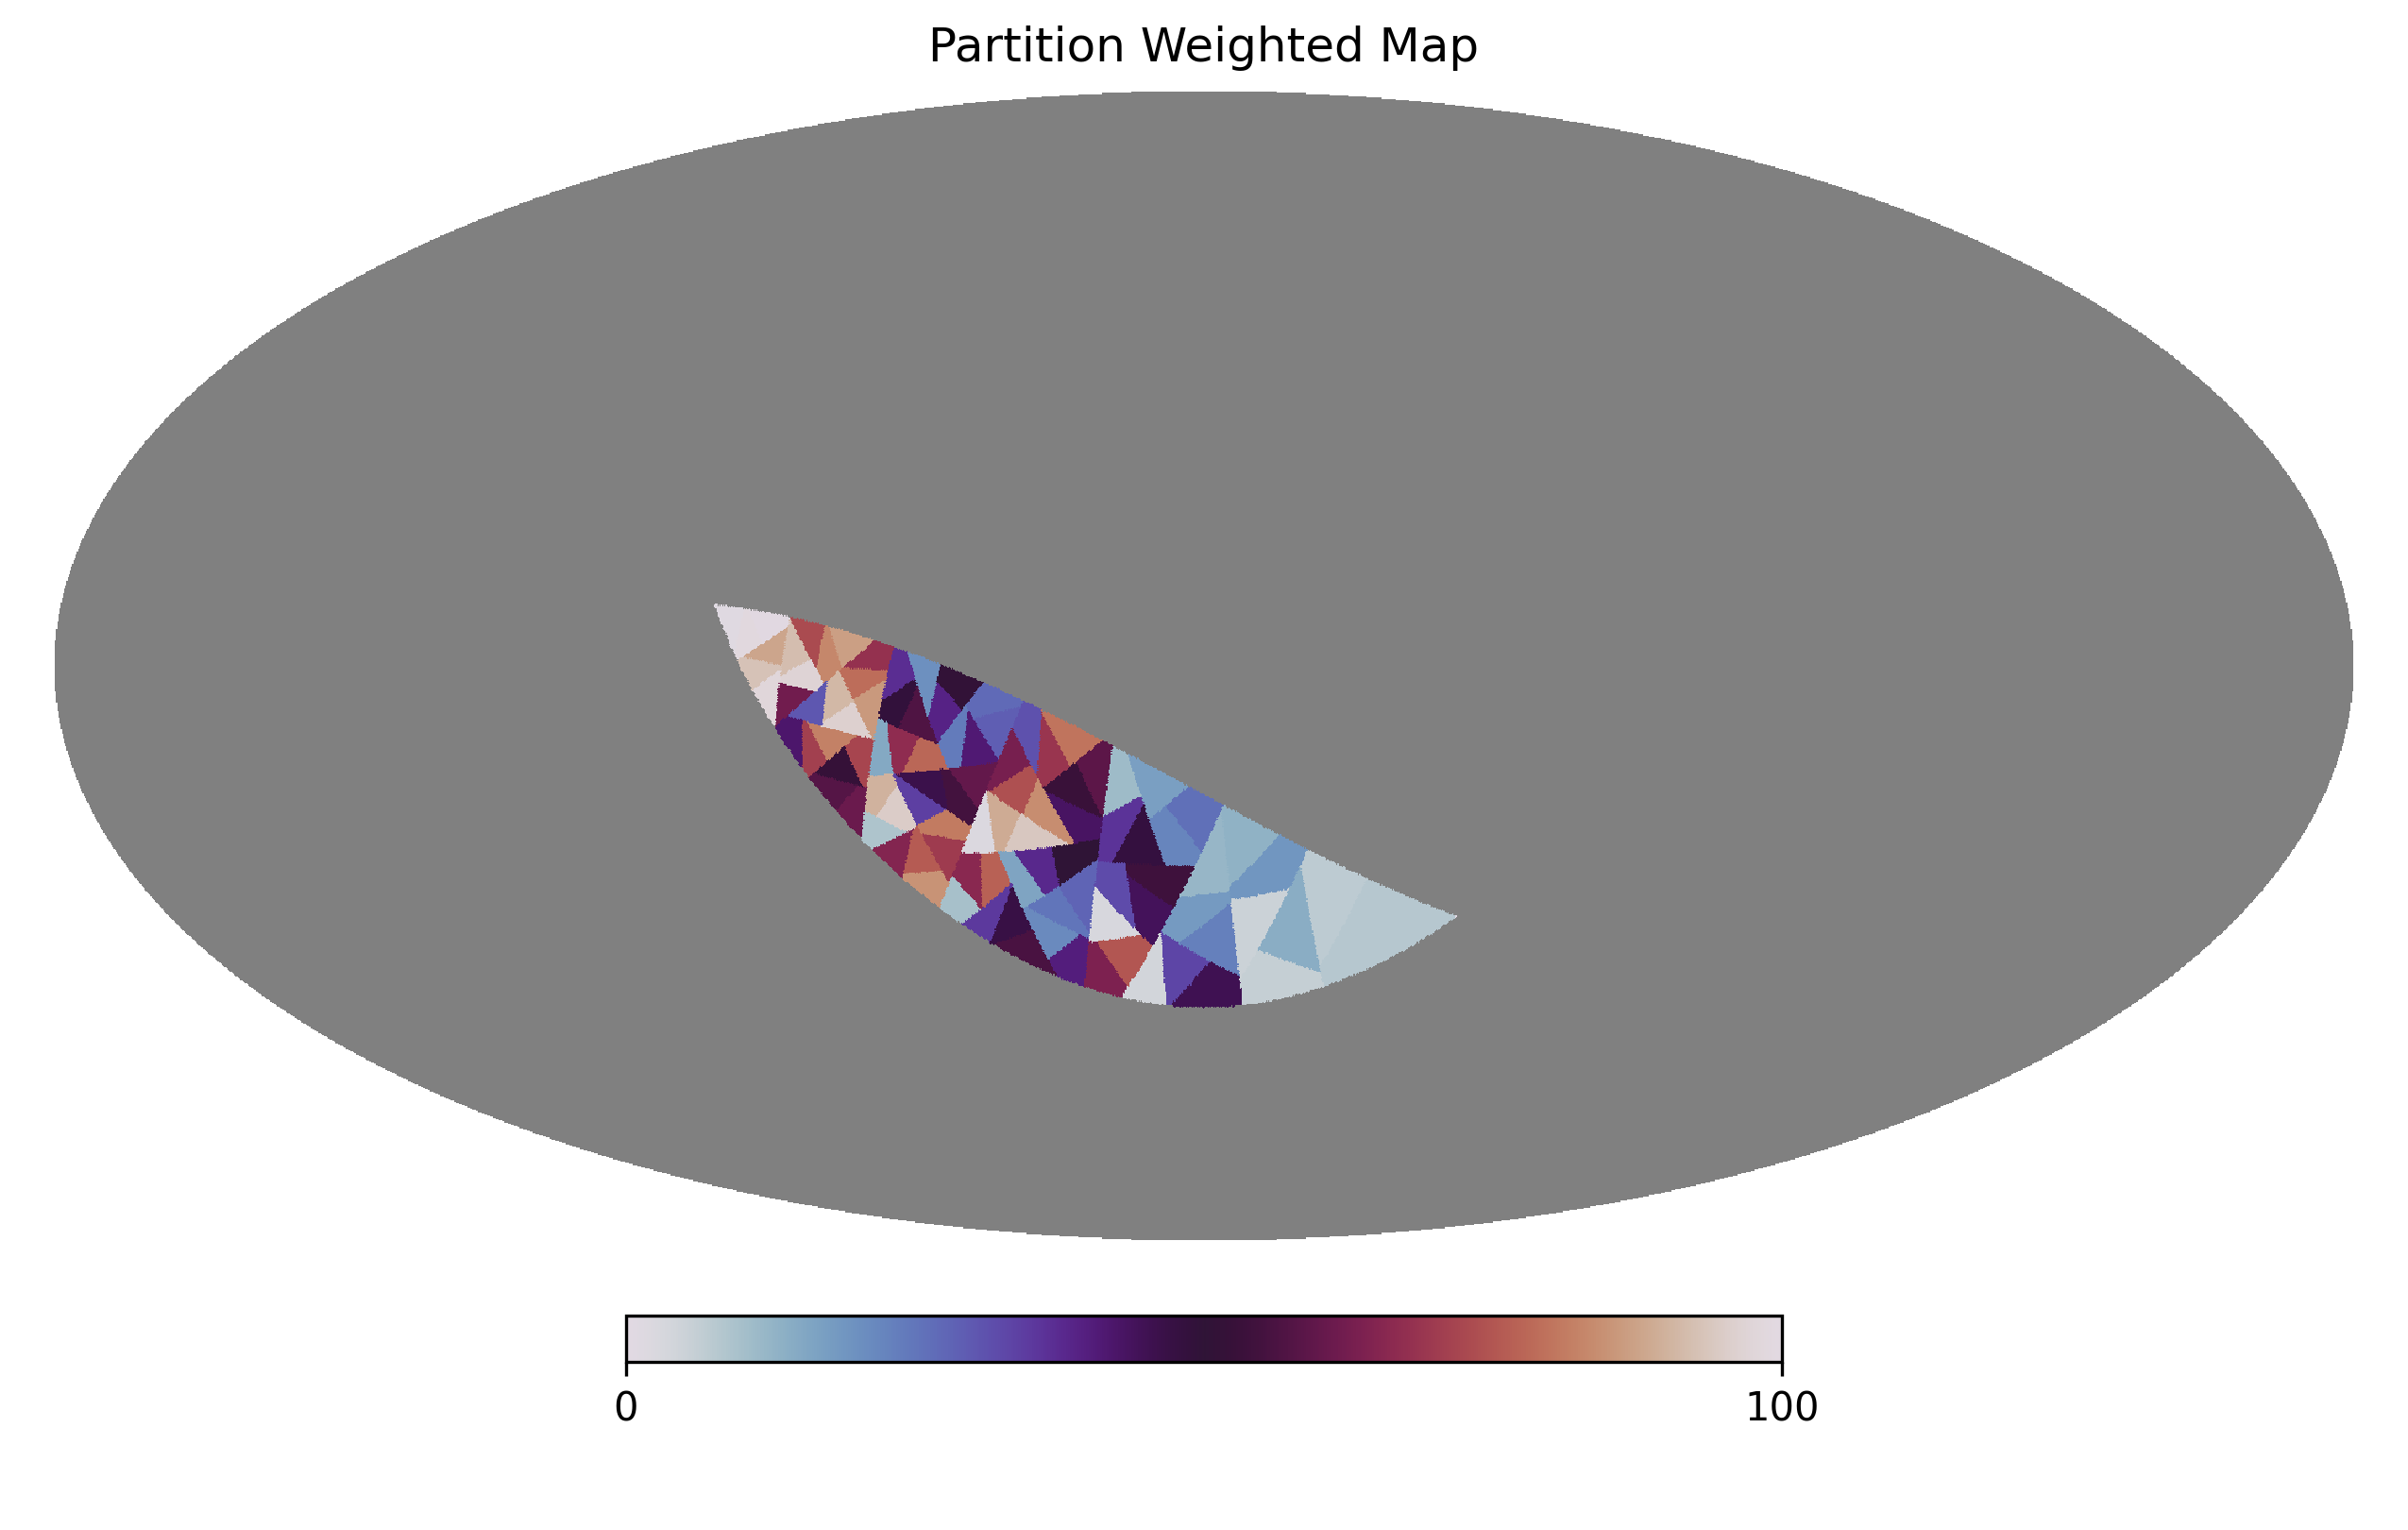
Partitioning a HEALPix map by weight
Let’s now partition the same map but now with a weight map:
Npartitions = 100

# in this example the weight map will be proportional to the latitude
weightmap = np.zeros(hp.nside2npix(nside))
pixID = np.where(mask == 1.)[0]
the, phi = hp.pix2ang(nside, pixID)
weightmap[pixID] = (phi - phi.min())/(phi.max() - phi.min())

# you must ensure the weightmap has the correct footprint, which can be done by
# multiplying the weightmap by the mask

weightmask = weightmap * mask

partitionmap = skysegmentor.segmentmapN(weightmask, Npartitions)

# and plotting the weighted partition map

## for plotting purposes let's mask out the masked region using healpy inbuilt function
partitionmap_masked = hp.ma(partitionmap)
partitionmap_masked.mask = np.logical_not(mask)

hp.mollview(partitionmap_masked.filled(), title='Partition Weighted Map', rot=180, xsize=2000, cmap='twilight')
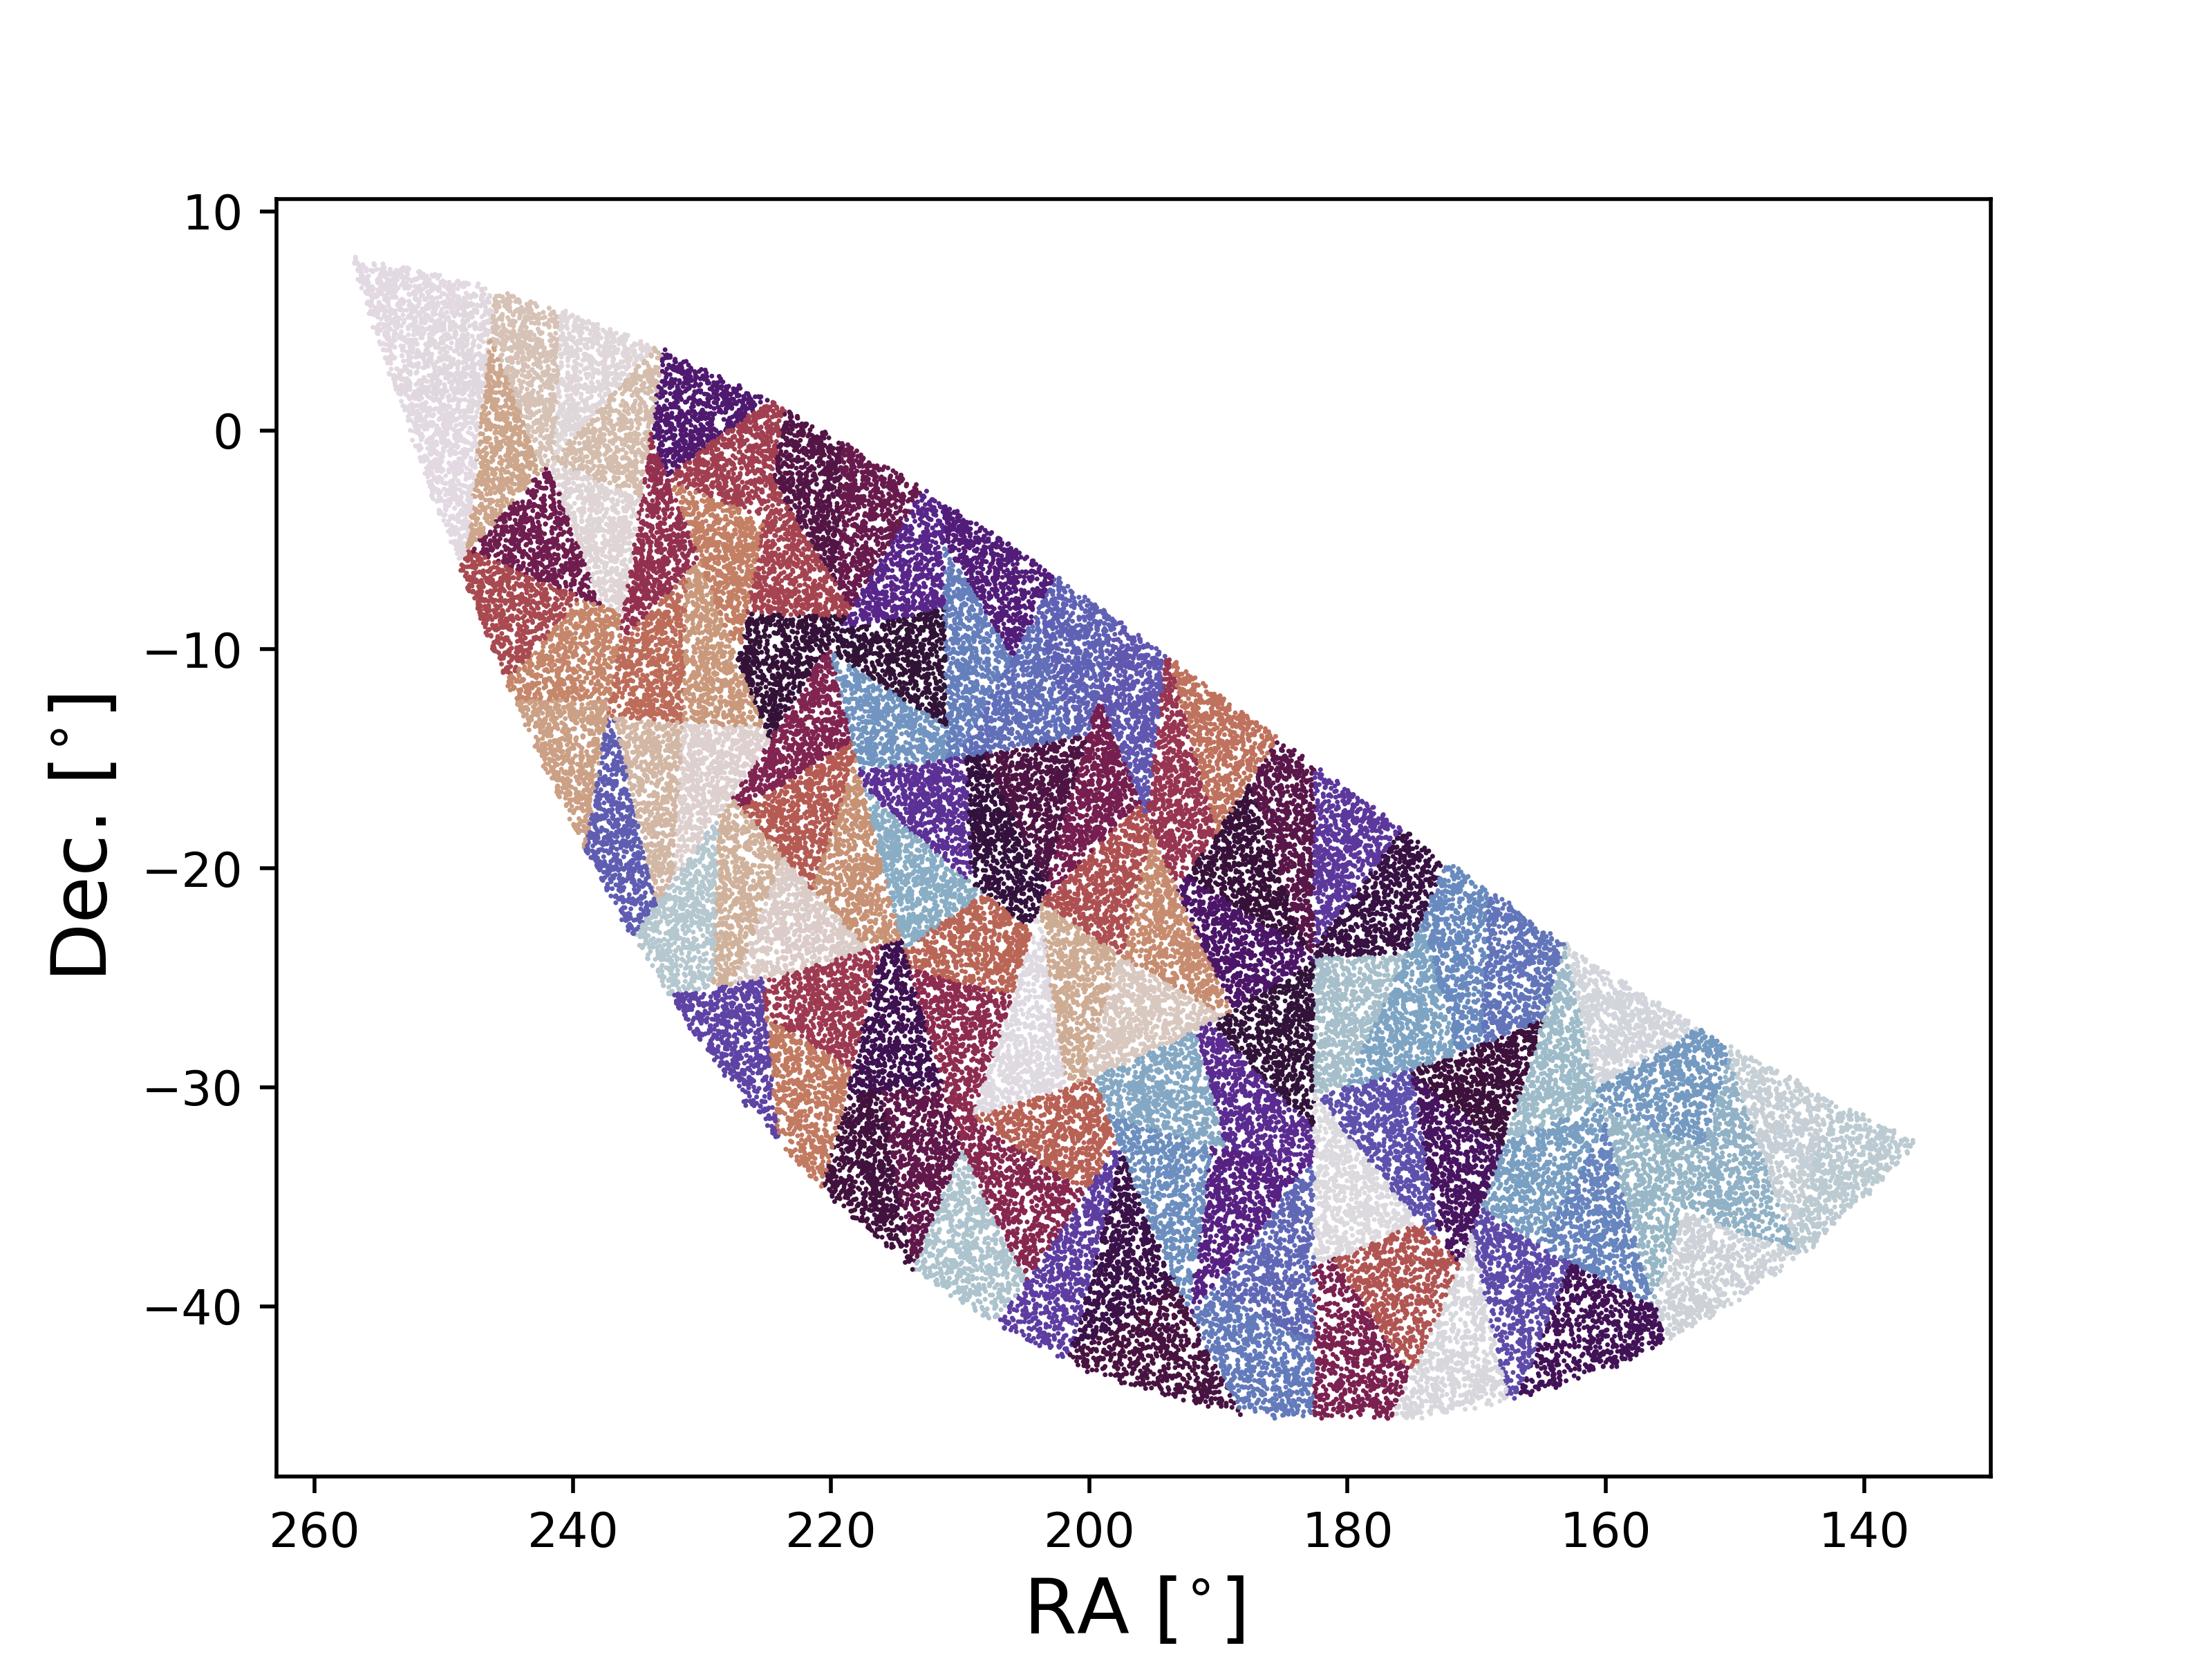
Partitioning a set of points
Points on the sphere in skysegmentor are alway defined in phi (longitude) and theta (latitude), both defined in radians where phi lies in the range [0, 2 pi] and theta [0, pi] where theta=0` is the north pole. To convert astronomical RA and Dec to phi and theta simply do:
phi = np.deg2rad(ra) # convert RA to phi
the = np.deg2rad(90.-dec) # convert Dec to theta
and to convert back
ra = np.rad2deg(phi) # convert phi to RA
dec = 90. - np.rad2deg(the) # convert theta to Dec
Let’s now partition a set of points
Npartitions = 100
# let's construct a set of points
pixID = np.where(mask == 1.)[0]
the, phi = hp.pix2ang(nside, pixID)
partitionID = skysegmentor.segmentpointsN(phi, the, Npartitions)
Npartitions = 100
# let's construct a set of points, this part can be replaced by your points ---
## this part will just create random points on a sphere...
size = 1_000_000
phi_min, phi_max = 0., 2*np.pi
theta_min, theta_max = 0., np.pi
u_phi = np.random.random_sample(size)
u_theta = np.random.random_sample(size)
phi = phi_min + (phi_max - phi_min)*u_phi
the = np.arccos(np.cos(theta_min) - (np.cos(theta_min) - np.cos(theta_max))*u_theta)
## now we mask out points outside of the mask defined earlier...
pixID = hp.ang2pix(nside, the, phi)
cond = np.where(mask[pixID] == 1.)[0]
phi, the = phi[cond], the[cond]
# -----------------------------------------------------------------------------
# If your points are in ra and dec simply convert to phi, theta as shown above
# and repeated here:
# phi = np.deg2rad(ra) # convert RA to phi
# the = np.deg2rad(90.-dec) # convert Dec to theta
# -----------------------------------------------------------------------------
# Now let's partition the points themselves!
partitionID = skysegmentor.segmentpointsN(phi, the, Npartitions)
# converting back to ra and dec for plotting.
ra = np.rad2deg(phi) # convert phi to RA
dec = 90. - np.rad2deg(the) # convert theta to Dec
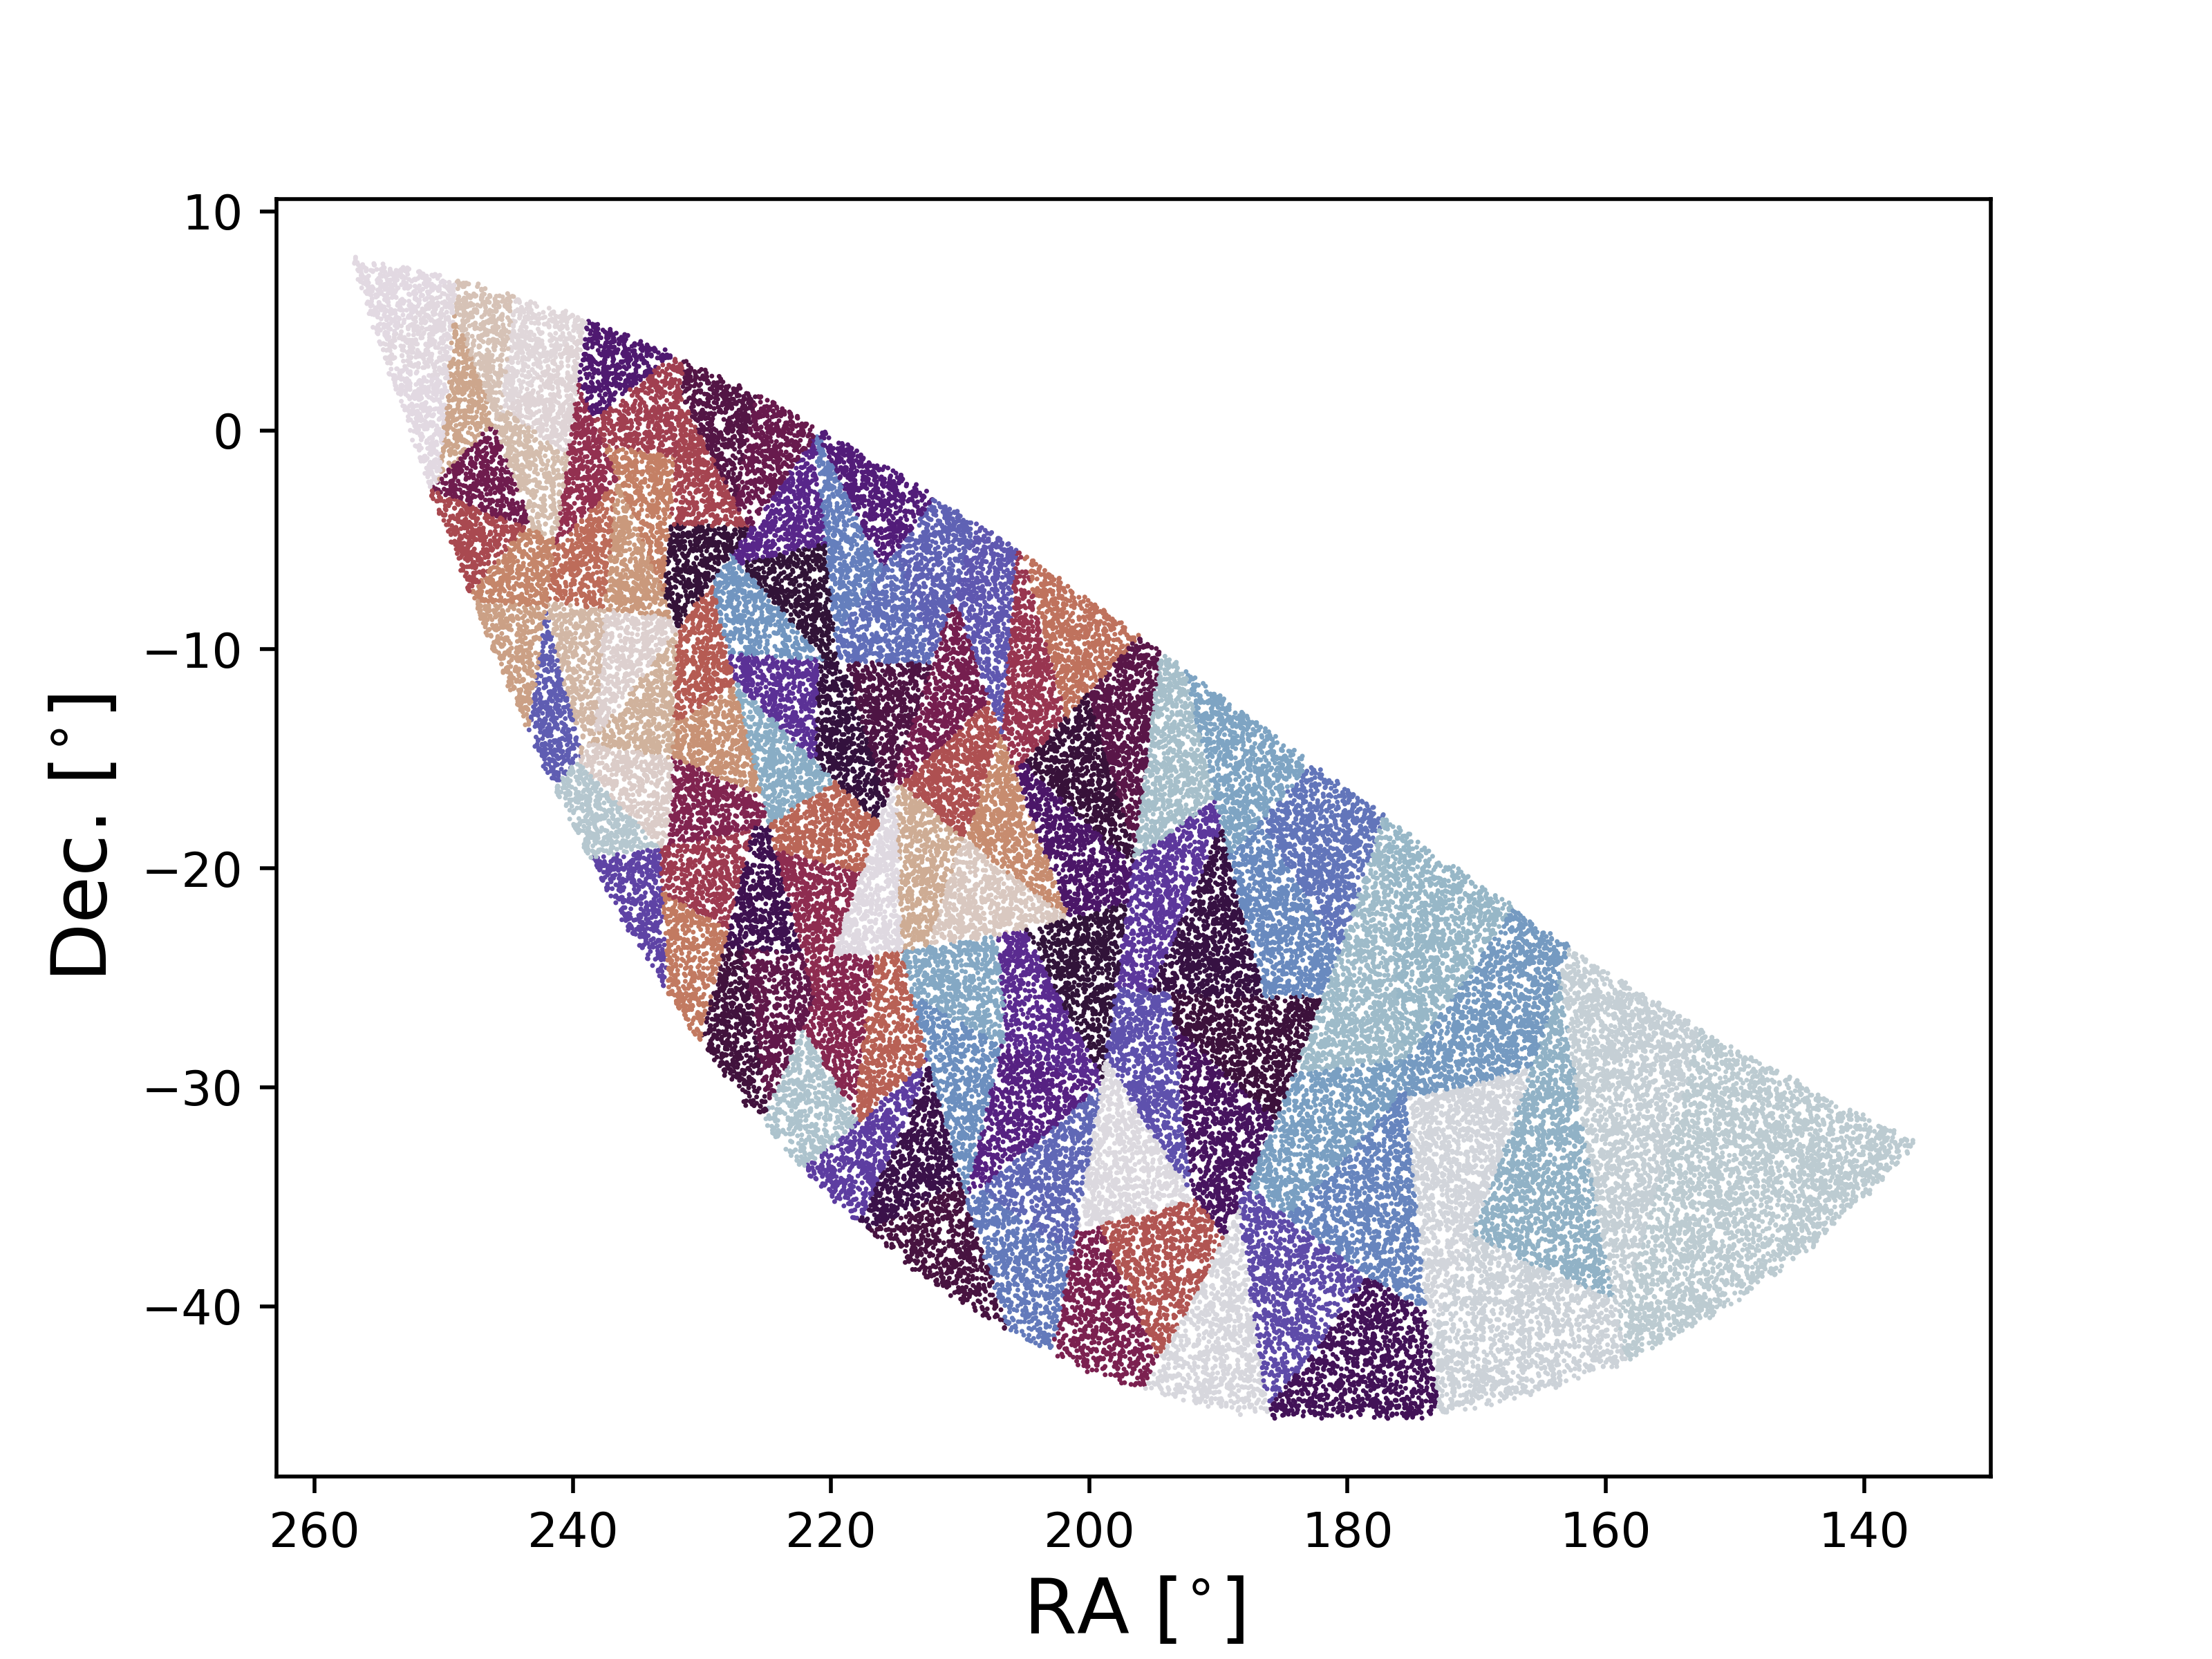
# plot points and partitionIDs
plt.scatter(ra, dec, c=partitionID, s=1., edgecolors='none', cmap='twilight')
plt.xlabel(r'RA [$^{\circ}$]', fontsize=16)
plt.ylabel(r'Dec. [$^{\circ}$]', fontsize=16)
plt.gca().invert_xaxis()
plt.show()
Partitioning a set of weighted points
If the points have weights, then this can simply be added as
Npartitions = 100

# let's construct some weights
weights = (phi - phi.min()) / (phi.max() - phi.min())

partitionID = skysegmentor.segmentpointsN(phi, the, Npartitions, weights=weights)

ra = np.rad2deg(phi) # convert phi to RA
dec = 90. - np.rad2deg(the) # convert theta to Dec

# plot points and partitionIDs

plt.scatter(ra, dec, c=partitionID, s=1, edgecolors='none', cmap='twilight')
plt.xlabel(r'RA [$^{\circ}$]', fontsize=16)
plt.ylabel(r'Dec. [$^{\circ}$]', fontsize=16)
plt.gca().invert_xaxis()
plt.show()